Root Cause Analysis

What is Root Cause Analysis?

Root cause analysis is a problem-solving method used to identify the underlying causes of an issue or failure rather than just addressing its symptoms. By systematically investigating a problem, RCA aims to uncover the primary factors contributing to the issue at hand, helping organizations implement long-term solutions and prevent recurrence. 
root cause analysis

The Basic Idea

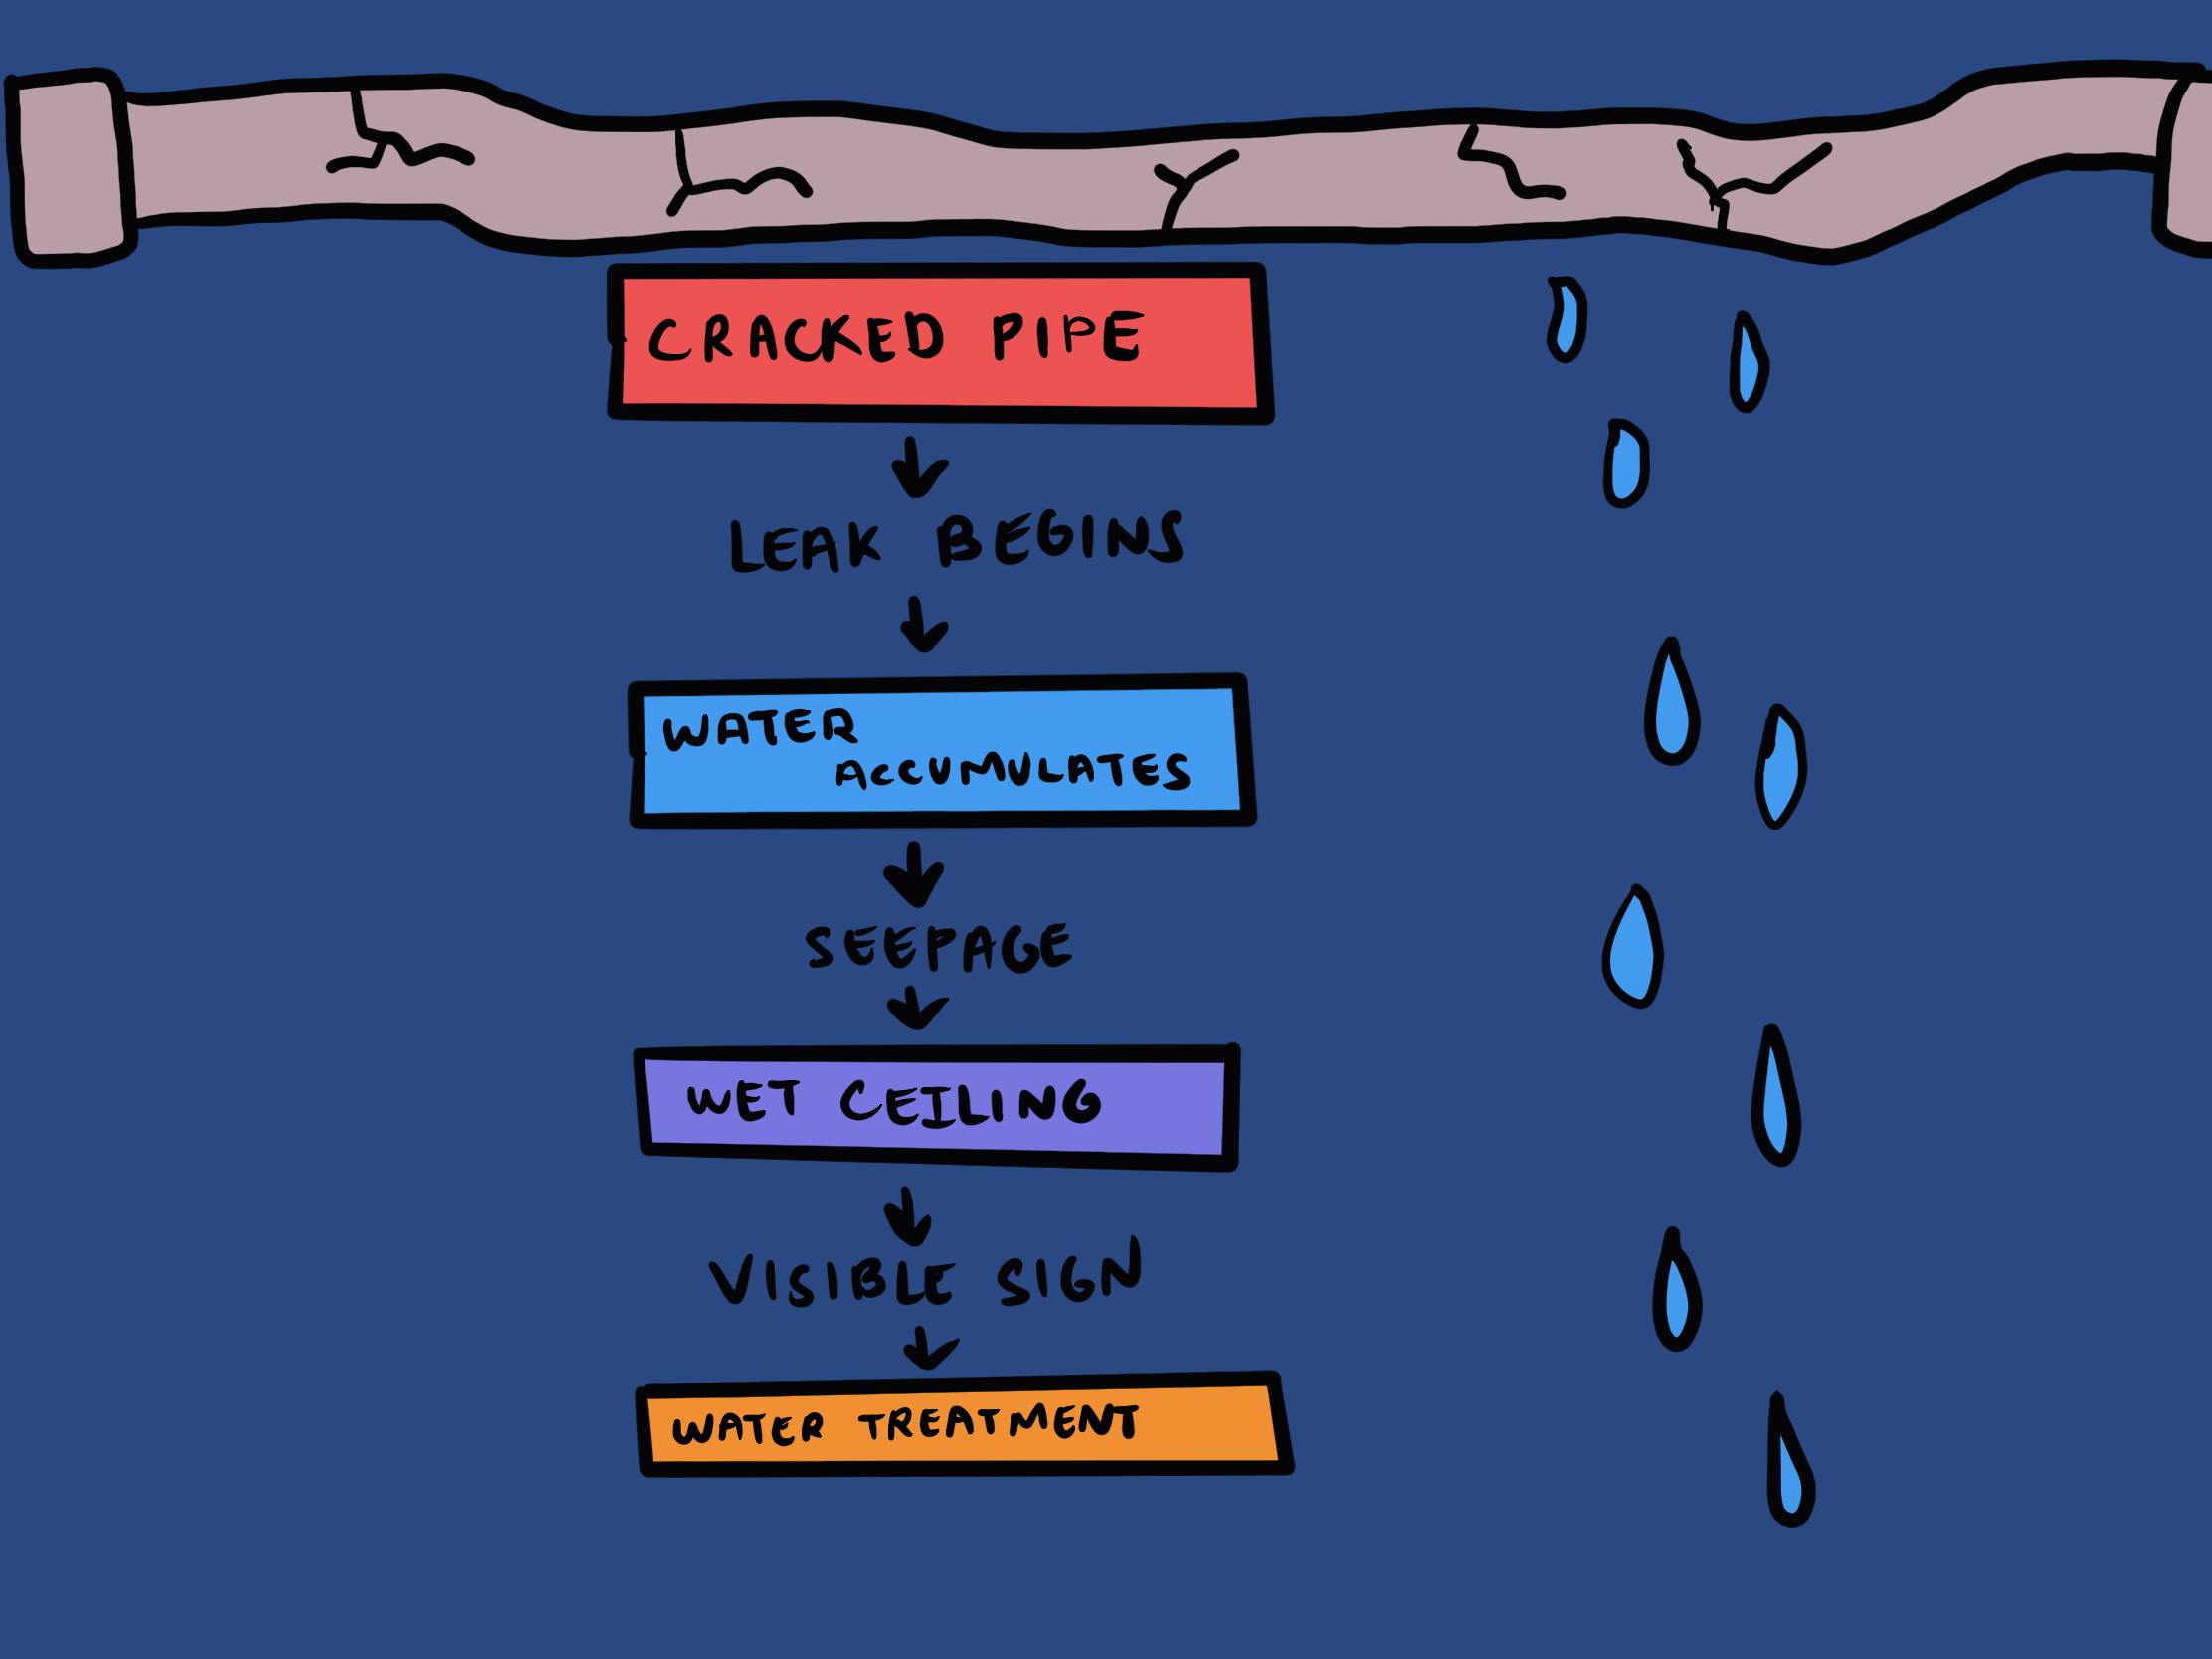
Imagine you notice water on your floor, dripping from a crack in the ceiling. You could place a bucket under the drip to stop it from damaging your floor as an immediate fix, but that wouldn’t solve the problem. Even patching up the crack in the ceiling with putty wouldn’t permanently fix the issue, as the water would eventually break through the putty again, leaving you with the same slippery situation as before. To fully address the problem, you would need to take a closer look at the pipes and analyze the damage. Through this investigation, you discover a crack in one of your pipes, and now you can fix it.

In this analogy, the water dripping is the symptom of the problem and the cracked pipe is the root cause. Root cause analysis is the process of identifying problems, then conducting research and collecting data to pinpoint their root cause. 

Root cause analysis is a quality management process used by organizations to identify corrective actions that will have long-term effects. Instead of taking the issue at face value, root cause analysis is based on the premise that there is often a lot more going on behind the scenes. Root cause analysis is focused on uncovering the “why” and “how,” rather than the “what” (the symptom).1

Here are the basic steps to conduct a root cause analysis:

  • Define the problem
  • Collect data
  • Identify the causal chain between a symptom and root cause
  • Implement solutions to address root cause2

For example, imagine you are the CEO of a company that sells medical equipment. You learn that in the past quarter, multiple sales representatives did not meet their monthly quota (defining the problem). A less experienced CEO might conclude that those sales representatives are not putting enough effort into their work and consider firing them. However, as the savvy CEO that you are, you believe there might be more to the situation than meets the eye. You take some time to conduct research and notice that all of these sales representatives joined the team around the same time six months ago (collecting data). That pattern may indicate that their onboarding process did not adequately prepare them for success (mapping out events that led to the symptom). Armed with this knowledge, you can address the root cause and adapt the onboarding process for greater success (implementing solutions). Voila, now your sales representatives are meeting their monthly quotas and you are making more money!

“Address the root cause and, in so doing, not just reduce the symptom seen in this instance, but improve the overall system...”


— John Hunter, author of Management Matters: Building Enterprise Capability3

Key Terms

Root Cause: The fundamental underlying issue leading to a symptom or number of symptoms that root cause analysis aims to identify.

Symptom: A tangible or visible problem that needs to be addressed. By identifying the root cause and implementing changes accordingly, root cause analysis seeks to make symptoms diminish or disappear.

Causal Chain: The sequence of events leading up to a symptom. In a root cause analysis, investigators try to trace a causal chain from the symptom back to a root cause.4

PDCA Cycle: Sometimes referred to as the Deming Cycle, the PDCA cycle is a project management framework for finding a root cause, involving a four-step process: plan, do, check, and act.

Five Why Analysis: A form of root cause analysis developed by Sakichi Toyoda and implemented as part of Toyota’s Production System. When a symptom arises, the five why analysis requires people to trace a causal chain by asking “why” five times to uncover the issue behind the symptom, then the issue behind that issue, and so on.5

Kepner-Tregoe Problem Solving and Decision Making: A four-step model that can be used for root cause analysis: situation appraisal, problem analysis, solution analysis, and potential problem analysis. The final step allows you to predict potential future symptoms and implement preventative actions to reduce their likelihood.6

Fishbone Diagram: Also known as the Ishikawa diagram, this is a visual representation of a root cause analysis that explores potential causes of a symptom, breaking them down into six ‘m’ categories: manpower (personnel), machines, measurements, methods, materials, and mother nature (the environment).2

History

During the first U.S. Industrial Revolution from 1760 to 1900, large-scale manufacturing injuries were disturbingly common due to frequent operational failures and accidents. As people were working with complex and dangerous machinery, these incidents not only led to diminished efficiency but often severe injuries or death. Instead of exploring what led to these accidents, companies would focus on the immediate consequences and typically blame individuals, attributing the issue to purely human error.7

Companies were too focused on end-of-line inspection, contributing to injuries and a costly and inefficient way of identifying and rejecting defective products. Walter A. Shewhart, an American physicist and engineer, introduced Statistical Process Control (SPC) in 1924 to shift focus from the finished product to the processes that produced them. Statistical Process Control helped to identify when a process was deviating from its normal state so that actions could be taken to fix the issue before defects occurred. The SPC used upper and lower control limits that defined the acceptable boundaries of variation, and if the variation went beyond those limits, an action had to be taken.8 SPC laid the foundation for investigating why deviations occurred, a key principle of root cause analysis. 

Shewhart also developed the Shewhart Cycle, a three-step repeating cycle for continuous improvement: specify, produce, inspect. This was one of the first instances where improvement was contextualized as a continuous, repeatable process, as opposed to a single action taken when a problem arises.8 

In the 1930s, Sakichi Toyoda, a Japanese industrialist and founder of Toyota Industries, developed the five whys technique for finding the root cause of a problem. Toyota was built on a ‘go and see’ philosophy, emphasizing the need to know what’s really happening on the scene. The five whys followed this philosophy,  encouraging problem-solvers to determine a root cause by asking why a problem is occurring, pushing further and further to identify the causal chain.9 

Although Shewhart and Toyoda already had laid the groundwork for root cause analysis, the need for a more structured approach to problem-solving gained momentum in the mid-20th century. After World War II, there was an increased interest in operations research and total quality control in Japan to help support economic reconstruction.10 

Kaoru Ishikawa, a Japanese engineering professor, developed the fishbone diagram, a visual way to represent how different causes lead to a symptom, allowing management to identify the issues that should be addressed.11 The implementation of root cause analysis created a culture of continuous learning and refinement, with companies using data-driven frameworks for total quality management. 

Fishbone Diagram showing different factors contributing to a problem, such as environment, people, machines, processes.

W. Edwards Deming, an American statistician who was mentored by Shewhart, visited Japan in the 1950s to give a series of lectures on statistical methods. There, he introduced The Deming Cycle, which added a fourth component to the Shewhart Cycle: design, make, sell, and test. This emphasized the need for constant iterations and improvements. In 1951, the Japanese Union of Scientists and Engineers altered Deming’s Cycle into the PDSA (plan, do, study, act) Cycle for continuous improvement. In order to problem-solve, teams must first determine the root cause of an issue and develop a hypothesis on why it is occurring so they can take corrective action accordingly.12 

 PDSA Cycle - Circle with four quadrants

In the 1950s, social scientists Charles Kepner and Benjamin Tregoe developed another framework for conducting root cause analysis: the Kepner-Tregoe Method. The method provided a four-step framework (situation appraisal, problem analysis, solution analysis, and potential problem analysis) to allow organizations to identify issues quickly and systematically make decisions to address them.13

Since the 1950s, root cause analysis has become an essential tool for continuous improvement across various industries. It became the gold standard for safety science in the aviation, nuclear power, and chemical industries to prevent fatal incidents.  In the late 20th century, root cause analysis spread to more diverse fields, such as healthcare, IT, and finance. Today, it is applied by most organizations as a systematic approach to uncovering underlying issues and preventing problems from occurring.14

People

Walter A. Shewhart

An American physicist and engineer who first introduced statistical quality control during his time at Bell Telephone Laboratories. His book, Economic Control of Quality of Manufactured Product, showed how statistical methodology could be applied to manufacturing. Shewhart is best known for the creation of the Statistical Process Control framework, which later became known as the Control Chart.15

W. Edwards Deming

Known as the father of quality improvement, Deming was an American economist and consultant who applied statistical methods to quality control.16 Deming built upon the work of his mentor, Walter Shewhart, and brought his ideas to Japan, leading to the globalization of quality improvement ideas and root cause analysis.17

Sakichi Toyoda

Japanese industrialist and inventor, Toyoda is best known as the founder of Toyota Industries Corporation. Throughout his career, Toyoda was interested in finding more efficient ways to create and manufacture goods. His first successful invention was the Toyoda wooden handloom for weaving cloth, the first loom to require only one hand to operate. He continued to make improvements to the loom and founded Toyota Industries Corporation. He integrated the five whys framework for root cause analysis into the Toyota Production System. Although the corporation initially focused on the manufacturing of spinning and weaving machinery, with its objective tied to invention and research, it has since evolved and is best known today for manufacturing automobiles.18 

Kaoru Ishikawa

A Japanese professor and engineer who developed multiple concepts and tools to support quality management. He is best known for creating the fishbone diagram, a visual depiction of a causal chain between a root cause and a symptom. Ishikawa also invented the concept of quality circles, groups of people who volunteer to meet and improve organizational performance.19 

Benjamin Tregoe and Charles Kepner

Social scientists and management consultants who co-developed the Kepner-Tregoe method, a structured framework for root cause analysis and decision-making that strives to answer four questions: what happened, why did it happen, how should we act, and what will the future result be? The Kepner-Tregoe method formalized this thinking pattern to allow for more efficient decision-making.20

behavior change 101

Start your behavior change journey at the right place

Impacts

Focusing on an isolated incident will cause an organization to spend time and money treating a symptom, which runs the risk of the same problem happening again. Root cause analysis, alternatively, promotes the development of lasting solutions. By providing a structured approach to uncovering underlying issues, root cause analysis can reduce risk, enhance problem-solving skills, and lead to greater efficiency. 

Long-Term Impact & Risk Management

Root cause analysis is based on the understanding that systems, processes, and events are all interconnected. If an organization focuses solely on a symptom, they are likely to implement a “band-aid solution:” a quick but superficial fix that will not resolve the underlying issue. Although the organization may resolve the immediate problem, the symptom will continue to pop up until they identify and address the root cause. 

Root cause analysis is fundamental to continuous improvement, as it embeds a culture of learning and problem-solving into an organization’s operations. By implementing tools like PDCA into an organization’s fabric, management can proactively and systematically find efficiencies and improvements before incidents occur.1 

Enhances Problem-Solving Skills

Root cause analysis requires organizations and employees to think critically. Instead of focusing on the immediate and obvious issue, RCA asks them to take a step back and spend time adequately analyzing the situation to understand the causal chain. By mapping out a causal chain, employees also gain a greater understanding of the interconnected factors within their system, helping them understand how even small variations can be consequential and motivating them to improve communication within their organization.21 

Improved Efficiency and Cost Savings

When mapping out causal chains, organizations are likely to notice inefficiencies within the system that are contributing to symptoms. Instead of constantly addressing symptoms—when the damage has already been done—RCA allows teams to explore the root of the issue so they can improve processes, leading to fewer wasted expenditures and greater optimization. 

For example, addressing issues such as equipment breakdowns, production delays, or quality defects at their source can lead to more consistent output and fewer disruptions. By investing in root cause analysis, companies can achieve long-term financial gains through more efficient and streamlined operations, ultimately improving their bottom line.

Controversies

Although root cause analysis is a valuable tool for addressing underlying concerns, the process can be resource-intensive, slow, and may not always address the full scope of complex issues. 

Time Consuming & Costly

Conducting a root cause analysis requires significant effort and can be time-intensive. A thorough analysis requires data collection, interviews with multiple individuals and teams, and detailed documentation. While the root cause analysis is being conducted, the symptom is not actively being treated, which may halt production. Sometimes, a quick fix to solve the symptom is necessary and can provide the organization with breathing room to later conduct a root cause analysis. In the long run, a root cause analysis will ideally maximize efficiency and lead to cost savings, but in the short term, it may seem like a hindrance. 

Swiss Cheese Model

According to the Swiss Cheese Model, developed in 1991 by James T. Reason at Manchester University, there is no singular root cause that leads to failures. Just like a piece of Swiss cheese, there are many holes varying in size, representing different shortcomings that contribute to an incident or failure. The Swiss Cheese Model suggests that there are several interconnected factors that need to be examined and explored, challenging the assumption of root cause analysis that failure can be traced through a causal chain to determine one underlying catalyst. Root cause analysis might, therefore, be too narrow in its approach, oversimplifying complex issues by assuming that there is only one cause.22 

Determines Causes Rather Than Solutions

Although root cause analysis is useful for identifying factors that contribute to a problem, it does not suggest solutions to address them. Unless root cause analysis is part of a cycle of continuous improvement, it traces a problem back to a cause, which when treated will only prevent that particular issue from arising again. To be more proactive, organizations may want to explore possible issues that would arise when they introduce a new process or piece of machinery. 

Case Studies

Root Cause Analysis for Medical Error Prevention 

Medical errors are among the top 10 causes of death and disability worldwide. While blame is often placed on individual doctors and nurses for making errors, there are various factors and environmental dynamics that lead to a doctor making a decision. In 2024, Gunjan Singh and colleagues from the Royal College of Obstetricians and Gynecologists conducted a study applying root cause analysis to better understand medical errors and develop a system-based intervention. 

The study applied root cause analysis to multiple incidents of medical error. In one case study, a 26-year-old woman who was 39 weeks pregnant was admitted to the hospital for her labor pains. The doctors identified fetal bradycardia, an irregular heartbeat for the baby, and proceeded to an emergency C-section. After the baby was delivered, the operating obstetrician asked a scrub nurse to perform a surgical count before he proceeded with the closure of the patient’s abdomen. The scrub nurse reported there was a missing gauze piece from the surgical trolley. As a result, the nurses had to conduct additional counts, and the doctor had to check the surgical field (the patient’s body) and conduct an X-ray to see if the gauze was there. Once they concluded the gauze was not in the surgical field, they finally performed the closure, ultimately delaying the completion of the surgery by about 2.5 hours. 

In this instance, it may seem reasonable to either blame the surgeon for making a mistake that led to a missing gauze piece or the scrub nurse for not conducting an accurate surgical count. However, a root cause analysis revealed that there were inconsistent practices for conducting surgical counts before procedures and that only the scrub nurse was responsible. To minimize human error, the recommendation was to standardize the counting process for systematically tracking equipment and to conduct it audibly so that other nurses involved in the process can speak up if an error is made.23

This case study shows how conducting root cause analysis allows us to understand the systemic source of an issue rather than blaming the symptom or individual so hospitals can implement corrective action that will diminish the likelihood of the medical error recurring. 

Root Analysis to Learn from the Success of Flight 1549

Oftentimes, root cause analysis is conducted as a response to a negative outcome or incident. However, RCA can also be applied to learn from a positive outcome.

Root cause analyses are common in the aviation industry to identify why a crash occurred. On January 15, 2009, US Airways flight 1549 experienced an issue that forced the pilot to “ditch” in the Hudson River. Remarkably, there weren’t any fatalities from the crash itself, or from hypothermia or drowning as a result of landing in the Hudson River. By conducting a root cause analysis, we can explore the series of decisions that were made that secured the safety of the 150 passengers and 5 crew members.

Think Reliability, a business management consultant company, conducted a root cause analysis on flight 1549. They began by defining the successful result, which prompted three questions to understand how no fatalities occurred:

  1. Why were there no fatalities in the city?
  2. Why was the plane able to land so smoothly on the water?
  3. Why were there no passenger fatalities on the aircraft?

The team then explored the causes behind each symptom. For the first question, they concluded that nearby residents were spared because the aircraft was ditched clear of populated areas and was at a sufficient altitude to ditch. For the second question, they attributed the smooth landing to the skills of the pilots, the nose of the aircraft being kept up, and the wings being maintained level. For the third question, they identified that there were no passenger fatalities because boats arrived quickly on the scene, avoiding hypothermia, the water extinguished flames, preventing deaths from fire, and the aircraft floated partially on top of the water, avoiding death by drowning. 

From this analysis, other airlines and pilots can learn what they should prioritize if they find themselves in an emergency situation. For example, they should look for unpopulated areas to ditch the plane and ensure that the nose of the aircraft is up and the wings level.24 

Related TDL Content

Why Government Project Fails: A Behavioral Analysis

It’s no secret that governments often fail to deliver on their promises. While we could explore the unique reasons behind failed government projects, the pattern suggests there may be a root cause common to all. In this article, directors Johnny Hugill and Richard Llewellyn from PUBLIC, a specialist government advisory firm, explore common behavioral root causes that lead to the failure of government projects. 

The Pareto Principle

The Pareto Principle is based on an “80/20” rule: 20% of causes are often responsible for 80% of outcomes. By conducting a root cause analysis to identify the 20% that have the largest impact on outcomes, the Pareto principle reveals where people and organizations should focus their efforts for maximum impact. In this article, former content creator Jeremy Buist explores where the Pareto Principle came from and where it is applied today.

Sources

  1. Tableau. (n.d.). What is root cause analysis? Tableau. Retrieved November 18, 2024, from https://www.tableau.com/analytics/what-is-root-cause-analysis
  2. Christiansen, B. (2024, May 24). How to do root cause analysis. Limble CMMS. Retrieved November 18, 2024, from https://limblecmms.com/blog/root-cause-analysis-rca/
  3. Hunter, J. (n.d.). Seeking systemic improvements: Root cause. W. Edwards Deming Institute. Retrieved November 18, 2024, from https://deming.org/seeking-systemic-improvements-root-cause/
  4. Thwink.org. (n.d.). Causal chain. Thwink.org. Retrieved November 18, 2024, from https://www.thwink.org/sustain/glossary/CausalChain
  5. MaxGrip. (n.d.). The five why analysis: A simple yet effective RCA tool. MaxGrip. Retrieved November 18, 2024, from https://www.maxgrip.com/resource/the-five-why-analysis-a-simple-yet-effective-rca-tool/
  6. Mind Tools Content Team. (n.d.). The Kepner-Tregoe matrix. Mind Tools. Retrieved November 18, 2024, from https://www.mindtools.com/atznth6/the-kepner-tregoe-matrix
  7. Sye, G. L. (2023, April 5). A short history lesson on root cause analysis. LinkedIn. Retrieved November 18, 2024, from https://www.linkedin.com/pulse/short-history-lesson-root-cause-analysis-george-lee-sye/
  8. Oventhal. (2019, February 14). The evolution of the Shewhart cycle. Oventhal. Retrieved November 18, 2024, from https://www.oventhal.com/blog/2019/2/13/the-evolution-of-the-shewhart-cycle
  9. Sultanov, Z. (2021, May 4). The origins of the 5 Whys technique. LinkedIn. Retrieved November 18, 2024, from https://www.linkedin.com/pulse/origins-5-whys-technique-zahid-sultanov/
  10. Kudo, N. (2012). Quality control strategy in Japan after World War II: Role of the TQC advocated by an educator W. Edwards Deming. Retrieved from https://www.academia.edu/32942926/Quality_Control_Strategy_in_Japan_aft_er_World_War_II_Role_of_the_TQC_Advocated_by_an_Educator_W_Edwards_Deming
  11. Hayes, A. (2023, January 1). Ishikawa diagram. Investopedia. Retrieved November 18, 2024, from https://www.investopedia.com/terms/i/ishikawa-diagram.asp
  12. Lean Enterprise Institute. (n.d.). PDCA. Lean.org. Retrieved November 18, 2024, from https://www.lean.org/lexicon-terms/pdca/
  13. Clifford, D. (2024, June 13). The Kepner-Tregoe method is a problem-solving and decision-making technique developed by Charles Kepner and Benjamin Tregoe in the 1950s. Medium. Retrieved November 18, 2024, from https://medium.com/goodbusinesskit/the-kepner-tregoe-method-is-a-problem-solving-and-decision-making-technique-developed-by-charles-6115e7900c3b
  14. Kandeel, E. (2024, June 26). Where did Root Cause Analysis (RCA) come from? LinkedIn. Retrieved November 18, 2024, from https://www.linkedin.com/pulse/where-did-root-cause-analysis-rca-come-from-eslam-kandeel-uyhnf/
  15. American Society for Quality (ASQ). (n.d.). Shewhart. ASQ. Retrieved November 18, 2024, from https://asq.org/about-asq/honorary-members/shewhart?srsltid=AfmBOopNluyR5JVG6nOaA5m8cLp3gdYVRYKhjCT_hziVO_IKrGtJXcWH
  16. Mason, M. (2015, August 24). Root cause: The foundation of successful improvement. PHQIX. Retrieved November 18, 2024, from http://www.phqix.org/content/root-cause-foundation-successful-improvement
  17. UEN Press. (n.d.). Edwards Deming. In Operations management: People and organizations. UEN Press. Retrieved November 18, 2024, from https://uen.pressbooks.pub/ompeople/chapter/edwards-deming/
  18. Toyota Industries Corporation. (n.d.). Sakichi Toyoda: The father of the Toyota Group. Toyota Industries Corporation. Retrieved November 18, 2024, from https://www.toyota-industries.com/company/history/toyoda_sakichi/index.html
  19. Creighton, S. (2022, October 10). Kaoru Ishikawa: The man who invented the fishbone diagram. LifeQi System. Retrieved November 18, 2024, from https://blog.lifeqisystem.com/kaoru-ishikawa
  20. Mulder, P. (2023, December 27). Kepner Tregoe method of problem solving. ToolsHero. Retrieved November 18, 2024, from https://www.toolshero.com/problem-solving/kepner-tregoe-method/
  21. Avatour. (n.d.). The benefits of root cause analysis in continuous improvement: A comprehensive guide. Avatour. Retrieved November 18, 2024, from https://avatour.com/article/the-benefits-of-root-cause-analysis-in-continuous-improvement-a-comprehensive-guide
  22. GeeksforGeeks. (2020, September 15). Advantages and disadvantages of root cause analysis. GeeksforGeeks. Retrieved November 18, 2024, from https://www.geeksforgeeks.org/advantages-and-disadvantages-of-root-cause-analysis/
  23. Singh, G., Patel, R. H., Vaqar, S., & Boster, J. (2024, February 12). Root cause analysis and medical error prevention. National Center for Biotechnology Information. Retrieved November 18, 2024, from https://www.ncbi.nlm.nih.gov/books/NBK570638/
  24. ThinkReliability. (n.d.). Flight 1549 "Miracle on the Hudson" cause map. ThinkReliability. Retrieved November 18, 2024, from https://dev.thinkreliability.com/case_studies/flight-1549-miracle-on-the-hudson-cause-map/?hsLang=en

About the Author

Emilie Rose Jones

Emilie Rose Jones

Emilie currently works in Marketing & Communications for a non-profit organization based in Toronto, Ontario. She completed her Masters of English Literature at UBC in 2021, where she focused on Indigenous and Canadian Literature. Emilie has a passion for writing and behavioural psychology and is always looking for opportunities to make knowledge more accessible. 

About us

We are the leading applied research & innovation consultancy

Our insights are leveraged by the most ambitious organizations

Image

I was blown away with their application and translation of behavioral science into practice. They took a very complex ecosystem and created a series of interventions using an innovative mix of the latest research and creative client co-creation. I was so impressed at the final product they created, which was hugely comprehensive despite the large scope of the client being of the world's most far-reaching and best known consumer brands. I'm excited to see what we can create together in the future.

Heather McKee

BEHAVIORAL SCIENTIST

GLOBAL COFFEEHOUSE CHAIN PROJECT

OUR CLIENT SUCCESS

$0M

Annual Revenue Increase

By launching a behavioral science practice at the core of the organization, we helped one of the largest insurers in North America realize $30M increase in annual revenue.

0%

Increase in Monthly Users

By redesigning North America's first national digital platform for mental health, we achieved a 52% lift in monthly users and an 83% improvement on clinical assessment.

0%

Reduction In Design Time

By designing a new process and getting buy-in from the C-Suite team, we helped one of the largest smartphone manufacturers in the world reduce software design time by 75%.

0%

Reduction in Client Drop-Off

By implementing targeted nudges based on proactive interventions, we reduced drop-off rates for 450,000 clients belonging to USA's oldest debt consolidation organizations by 46%

Read Next

Notes illustration

Eager to learn about how behavioral science can help your organization?